
EO Operators want a faster GTM: Introducing CI Metrics
May 5, 2022
Earth observation (EO) data’s moment is finally here. Today, airborne and satellite sensors are used in a variety of decision-making areas such as climate resilience, monitoring natural disasters, measuring land-use change, and natural resource management.
Significant growth is seen in the so-called “upstream” sector, i.e., the platform operators for such sensors who generate this EO data and sell it downstream. These can be classified into platforms such as satellite constellations, high altitude balloons, or drones, which generate data that is mainly either optical, hyperspectral, or radar data, alongside newer types such as thermal and microwave.
As the pent-up demand for this data increases with climate awareness and measures of risk control, so does the number of companies collecting a range of earth imagery and data at higher resolutions. This is particularly true for satellite-based earth imaging, bringing economies of scale to image larger areas of the planet. While high-priced optical data was the cradle of this revolution inspired by the Cold War era, today, the miniaturized electronics boom fuels cheaper and smaller satellites and sensors, as well as enhances our ability to revisit the planet by 10x. Both the resolution and the number of bands per satellite have steadily increased, slowly ushering in an era of sub 5m hyperspectral and SAR (radar) imagery. Companies at the forefront of this revolution include Pixxel, Satellogic, Iceye/Capella Space, ADA Space, and others that have recently raised millions of USD across venture/IPO stages to solve for timely access to actionable data and insights. They are well funded and growing in size, capabilities, and numbers.
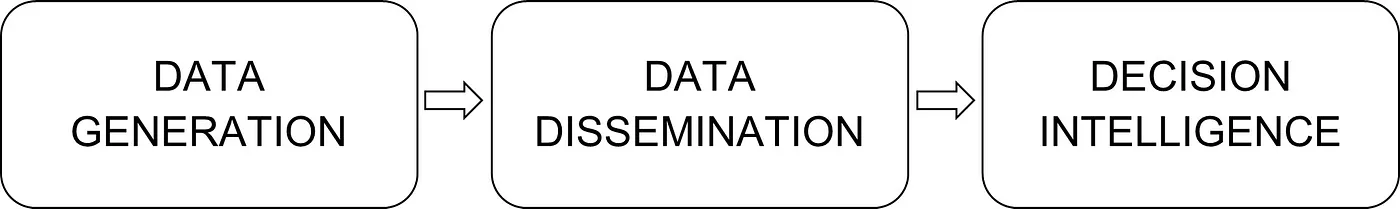
The above simple schematic breaks this large ecosystem down into 3 main categories:
Data Generation: The upstream satellite/balloon/drone operators, focused on manufacturing/integrating/launching with sensors to capture data and sell to bankers, insurers, mining companies, oil and gas corporations, the military, or the middle layer.
Data Dissemination: The ‘middle layer’ of delivery channels, which are aggregators and/or marketplaces, or just software architecture focused.
Decision Intelligence: Analytics applications (Generally SaaS dashboards) that transform the above raw data and generate actionable decision intelligence fed directly to the end-user. These companies can be vertical agnostic or specific.
These 3 categories however are not mutually exclusive — satellite operators may have their own distribution channels and analytics solutions, while some companies may be both marketplaces as well as decision intelligence providers. The Operating EO Stack Chart by TerrawatchSpace describes the above layers and actors in more detail.
Our mission is to help the DATA GENERATORS Go-To-Market accurately and in a timely manner.
Consider this:
You have deep technology expertise on the sensor platform (your USP and data horse) and are about to launch your first satellite. You are able to find a manufacturing partner/components vendor, your payload has been validated internally, and you see there is customer interest in your data. You get the payload/satellite built, tested, reviewed, and cleared for launch, and are able to successfully receive raw data from the satellite post-launch.
Now comes a big challenge! Build the processing chain and deliver the analysis-ready data to the customer. This is where most EO companies falter vis-a-vis the technical expertise required for image processing. Several issues plague the operators in this phase and keep them from meeting customer deadlines in a timely fashion. We try to give a snapshot of each of the steps with examples/problems solved by teams around the world similar to ours.
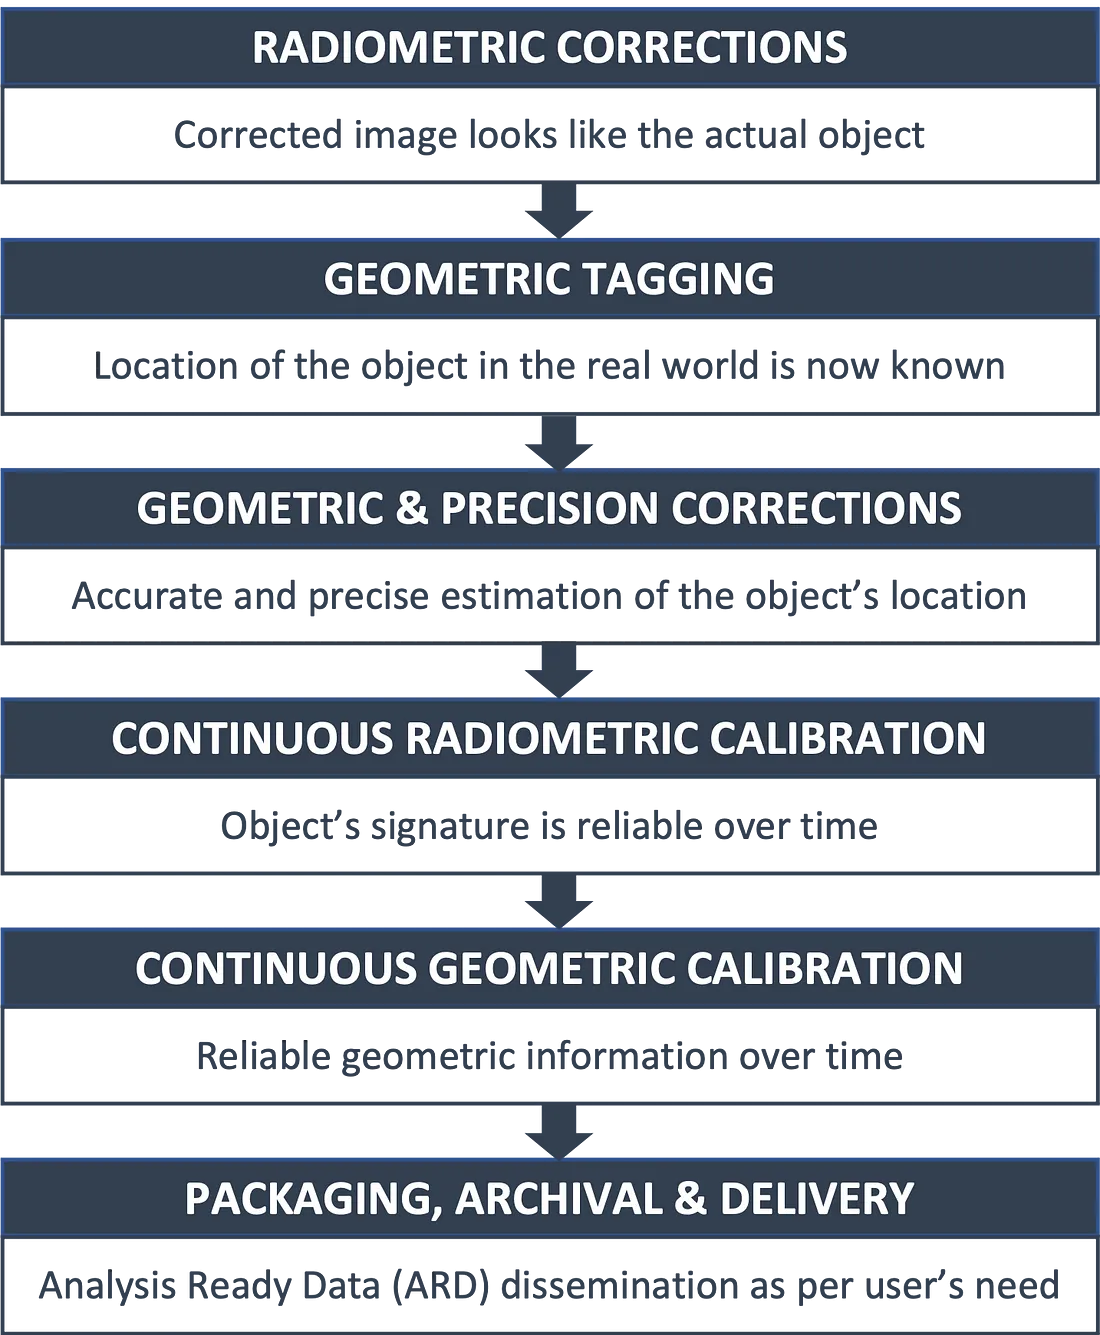
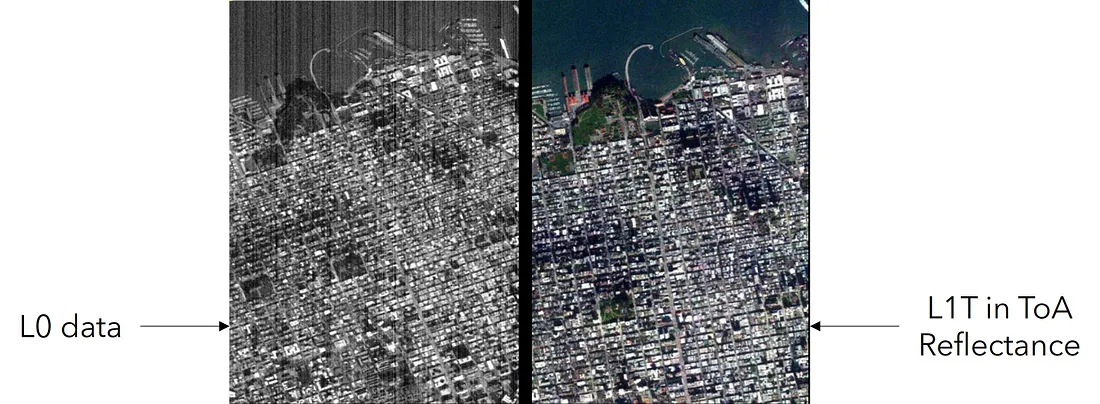
A. Radiometric Sensing and Corrections:
This is the first and crucial step in the chain that senses and identifies an object via its reflectance (unique to every object).
Corrections to the Camera Electronics Transfer Function, Camera’s Optical Response, Detector’s Non-uniformity, and assigning a Digital Number (DN) to the input Radiance measurement.
Next, we account for atmospheric conditions (fog, cloud cover, aerosols, etc), sun illumination conditions, and imaging geometry and convert radiance into reflectance. Now we have mapped the Digital count (Electrical Quantity) to Reflectance (Physical Quantity).
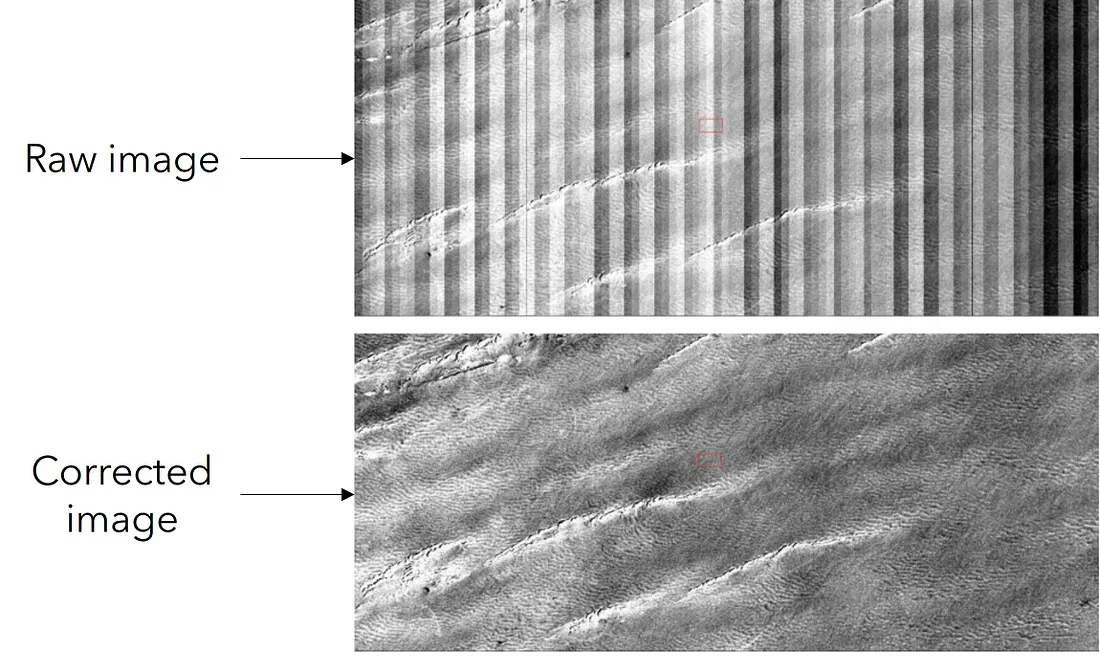
Now we have a corrected image that is a true representation of the actual object and we are ready for the next step!
The below figure shows what this process looks like: sensor-inherent properties such as striping, noise, and point spread functions present in the raw image deteriorate its quality. After all the corrections are applied, the output (bottom) image is much closer to a true representation of the object.
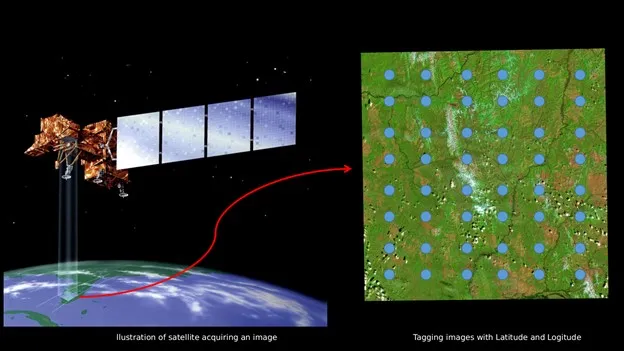
B. Geometric Tagging:
The second step in the process maps the ground location (lat, long) coordinates to an image coordinate (x,y). Now we know where this object is located in the world.
Several corrections need to be accounted for, such as:
Detector placement
Way of imaging (pushbroom scanning/whiskbroom/any other)
Pose, position, the orbit of the satellite
Camera optics & distortions
Underlying DEM and relief corrections
C. Geometric Projections & Precision Corrections:
The third step in the processing chain is to convert the 3D location into an accurate 2D projection of the earth, correct for precision using known reference points, and output an image with Reliable Geometric Quality.
This step uses the radiometrically corrected image from Step A and a tagged coordinate (lat, long to x, y) from Step B and maps to a commonly used 2D Earth map (UTM, Geographic Projections).
Post this mapping, we solve for inconsistencies arriving from the pose, position, and velocity of the imaging platform that is never accurate to the tee.
Alignment with GCPs (ground control points) and reference images, in orbit calibrations, are carried out in the initial phase of the commissioning of the platform. This exercise is repeated during each orbit to accurately measure minute deviations and account for them. Now we have an accurate and precise estimation of where the object is located in the world.
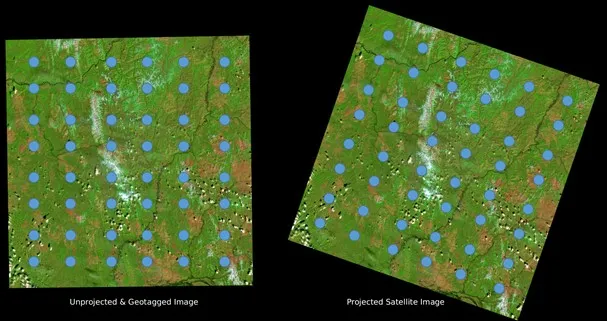
The above image showcases Lat-Long Geo-tagging for Satellite Image and Re-projection on the Ground.
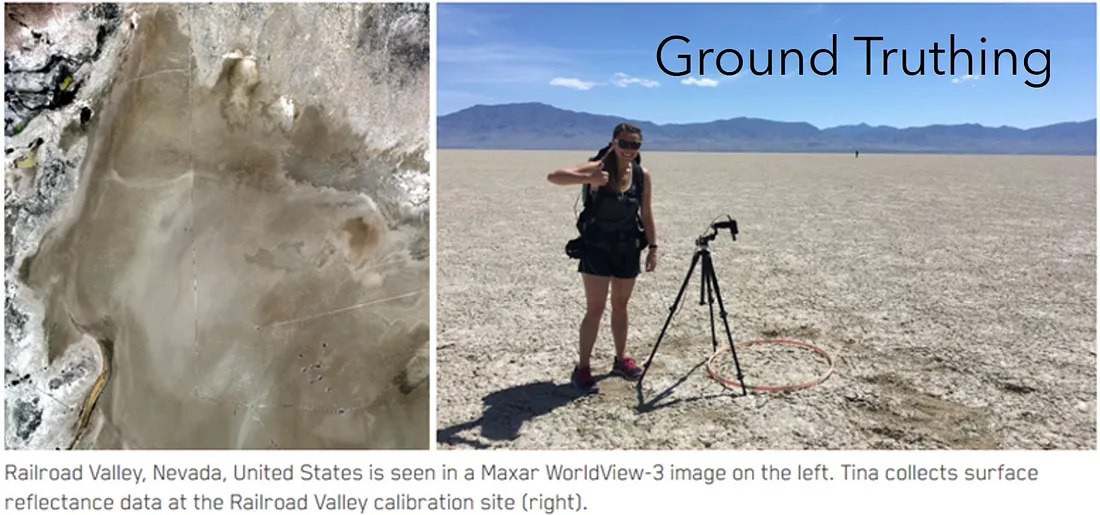
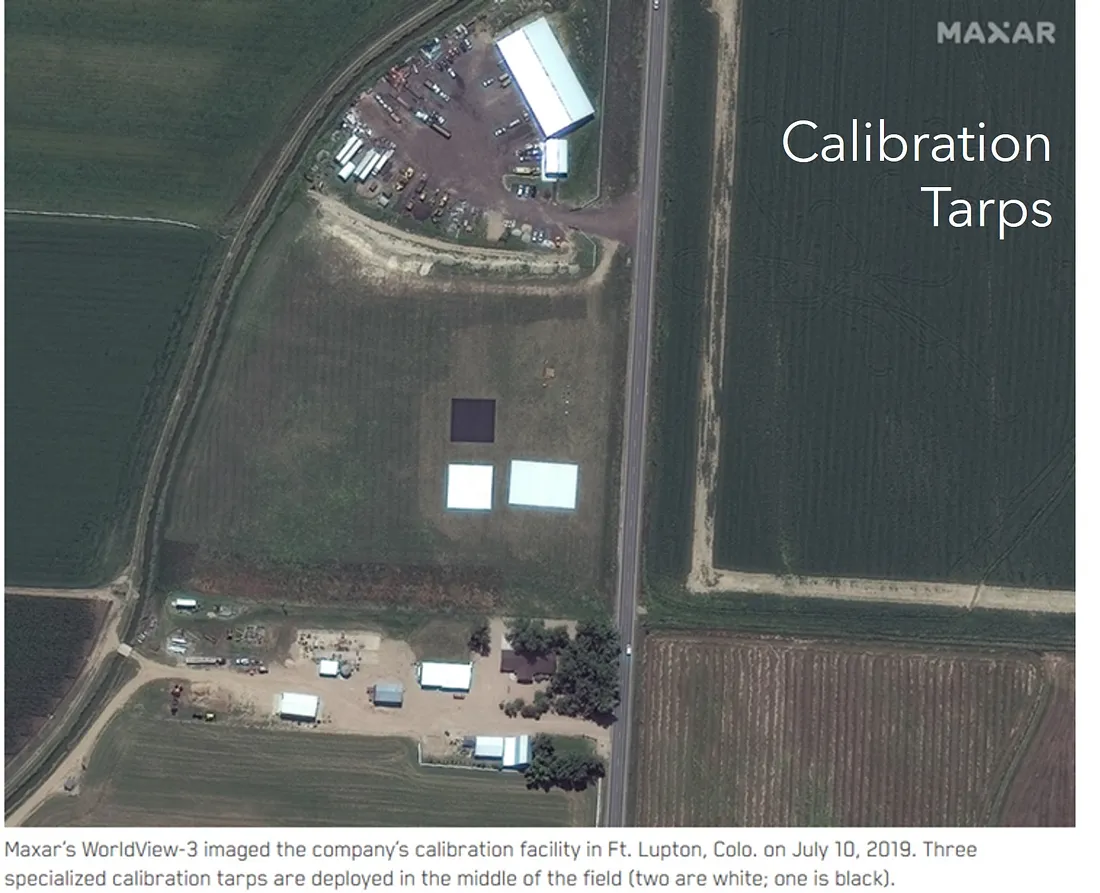
D. Continuous Radiometric Calibration:
The fourth step allows for monitoring and correcting deviations over a platform’s lifetime. Sensors degrade with time, and measurement uncertainties crawl in. Moreover, calibration uncertainties change with time. The same site with the same imaging parameters can give different DN/ radiance values at different times in the lifetime of the sensing platform. Hence, the payload/sensor needs to be continuously monitored (say every 21 days).
Ground Truthing helps establish physical verification of radiance measurements. Cross-checking performance over well-known radiometric calibration sites, usage of the moon or stars as a reference, cross-referencing other reliable imaging platforms all help in establishing regular credibility of data.
With continuous monitoring and correction, now we know that the object and its properties are reliable, accurate, and precise over time.
The above image showcases Lat-Long Geo-tagging for Satellite Image and Re-projection on the Ground.
D. Continuous Radiometric Calibration:
The fourth step allows for monitoring and correcting deviations over a platform’s lifetime. Sensors degrade with time, and measurement uncertainties crawl in. Moreover, calibration uncertainties change with time. The same site with the same imaging parameters can give different DN/ radiance values at different times in the lifetime of the sensing platform. Hence, the payload/sensor needs to be continuously monitored (say every 21 days).
Ground Truthing helps establish physical verification of radiance measurements. Cross-checking performance over well-known radiometric calibration sites, usage of the moon or stars as a reference, cross-referencing other reliable imaging platforms all help in establishing regular credibility of data.
With continuous monitoring and correction, now we know that the object and its properties are reliable, accurate, and precise over time.
E. Continuous Geometric Calibration:
The fifth step follows the fourth, like drifts of offsets within Position & Pose measurement sensors (star sensor, IMU, GPS, etc. ) need to be continuously calibrated. Teams stop early degradation by tracking and correcting every 30 days. Now we have Reliable Geometric Information over Time. After Steps D and E, we now also have ARD (Analysis Ready Data).
F. Product Packaging, Archival & Efficient Delivery:
The sixth and final step in the process is to make the end user’s life easier, and this is highly customized to the application and requirements. Customer requirements vary, from needing to access data easily to very specific corrections to be implemented (mosaic, pre-sampling, integrating this process with their own modules). Sometimes, they may even want to bypass some of the corrections mentioned in previous steps. All of this ends up at two final steps:
Packaging: Making use of a user-friendly format, in a graspable UX that is compatible with most commercial off-the-shelf packages. Compression methods are also applied at this stage so that large amounts of data can be stored efficiently.
Archival: Archiving the data in an organizing method as necessary (this may be date-wise, lat-long wise, or custom prescribed by the customer), so that access is guaranteed via APIs at a later point in time.
Now the customer has Analysis Ready Data in a usable, preferred packaging format and can start using/selling this ARD right away.
Here, we have tried to present a simplified description of the entire processing pipeline that is necessary to convert raw sensor data into a format that is usable and ready for downstream analytics. And even this is specific to different platform owners and varies quite a bit from operator to operator. Having different kinds of data at higher resolutions is great, but this also needs to be met with improved processing pipelines that ensure the data is user-friendly. For data generators that are focused on building the platforms and even sometimes developing the analytics for different markets, these are important intermediary steps to be considered. We are a team dedicated to making this entire process as simple and cost-effective as possible for the modern age operators looking to make it big!